

 ''
''
Performance data
We are thrilled with the exceptional Key Stage 2 (KS2) results achieved by Grange Park Primary School. As revealed in the latest data from the Department for Education, Grange Park Primary School has achieved remarkable success, ranking very high in performance measures. You can explore the details on the official government website: Link to Results.
Furthermore, our exceptional performance extends across various key stages, consistently surpassing the national average in most cases.
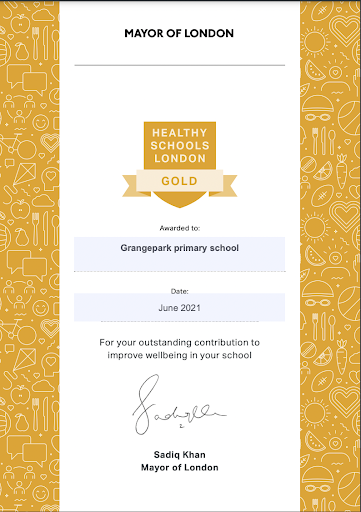
All these results are a testament to the dedication of our children, the excellence of our teaching staff, and the supportive community that surrounds us. We are proud of this significant accomplishment and remain committed to fostering a learning environment that enables all our children to thrive and excel. Congratulations to everyone at Grange Park Primary School on this remarkable achievement!
| End of EYFS |
|
|
|---|---|---|
|
|
School |
National |
| Good Level of Development | 81% | 67.2% |
| Phonics Screening | ||
|---|---|---|
| School | National | |
| Year group | Achieving the expected standard | |
| Year 1 | 94% | 79% |
| Average score | ||
| 36.4 | 33.0 | |
| Year 2 | 95% | |
|
End of KS1 Teacher Assessments |
||||
|---|---|---|---|---|
|
School |
National |
School |
National |
|
|
Subject |
EXS+ |
EXS+ |
GDS |
GDS |
|
Reading |
73% |
68% |
24% |
19% |
|
Writing |
68% |
60% |
12% |
8% |
|
Maths |
81% |
70% |
22% |
16% |
|
End of KS2 Assessments – Attainment |
||||
|---|---|---|---|---|
|
School |
National |
School |
National |
|
|
Subject |
EXS+ |
EXS+ |
GDS |
GDS |
|
Reading |
88% |
73% |
40% |
29% |
|
Writing |
89% |
71% |
42% |
13% |
|
Maths |
93% |
73% |
46% |
24% |
|
RWM combined |
83% |
60% |
28% |
8% |
|
GPS |
93% |
72% |
56% |
30% |
|
End of KS2 Assessments – Average scaled scores |
|||
|---|---|---|---|
|
|
|
School |
National |
| Subject | |||
|
Reading |
|
108 |
105 |
|
Maths |
|
109 |
104 |
|
GPS |
|
109.9 |
104.9 |
|
Progress Measures – KS1 to KS2 |
|||
|---|---|---|---|
|
|
|
School |
National |
| Subject | |||
|
Reading |
|
1.51 (above average) |
0.04 |
|
Writing |
|
4.1(above average) |
0.04 |
|
Maths |
|
3.52 (above average) |
0.04 |
Please click the link to access the Performance Tables for Grange Park Primary School.